Public safety touches every corner of Iowa life. When crime rates rise or fall, the effects reach into neighborhoods, schools, and family decisions about where to live and work. Understanding the data, and what drives it, gives residents the tools to hold government accountable for one of its most fundamental responsibilities.
Iowa has long been considered one of the safer states in the country, but that reputation doesn’t mean the picture is uniform. Violent crime clusters unevenly across the state, with urban centers showing markedly different patterns than rural counties. The gap between Des Moines and a small farming community in northeast Iowa can span hundreds of incidents per 100,000 residents.
Results Iowa tracks public safety as a core performance area, providing transparent, measurable indicators so citizens and stakeholders can observe how state government performs on crime reduction. The platform connects raw data to policy goals, letting residents see not just what the numbers show but whether progress is being made. For a broader view of how Iowa measures quality of life across policy areas, the Results Iowa performance measurement platform covers the full range of state accountability indicators.
What Counts as Violent Crime in Iowa?
Violent crime is a defined legal category, not a catch-all term for harmful acts. The FBI’s Uniform Crime Reporting program, which Iowa law enforcement agencies report to annually, classifies four offense types as violent crime: murder and nonnegligent manslaughter, forcible rape, robbery, and aggravated assault. These four categories form the basis of all statewide crime rate calculations.
Rates are expressed as incidents per 100,000 residents, which allows meaningful comparisons across jurisdictions of very different sizes. A town of 5,000 with 10 aggravated assaults and a city of 500,000 with 100 can be evaluated on the same scale. That methodology matters because raw counts often mislead. The numerically larger city may actually be safer on a per-capita basis.
The offense types tracked within Iowa’s violent crime framework include:
- Murder and nonnegligent manslaughter
- Forcible rape and sexual assault
- Robbery (theft by force or threat of force against a person)
- Aggravated assault (attack with a weapon or intent to cause serious bodily injury)
- Simple assault, tracked separately for trend context
How Is Violent Crime Tracked and Measured Across Iowa?
Iowa law enforcement agencies submit incident data to the Iowa Department of Public Safety, which compiles it into annual crime reports and feeds it into the FBI’s national database. That reporting pipeline creates a shared record spanning local, state, and federal levels. Published figures typically reflect the prior reporting year, so data always carries a one- to two-year lag.
The state’s performance measurement approach ties this data to quantifiable objectives. Rather than simply noting that crime went up or down, the framework asks whether specific programs and investments are producing the outcomes they were designed to produce. That’s a meaningful distinction. It shifts the conversation from observation to accountability, and it’s central to how Results Iowa approaches public safety reporting.
“Violence is a serious public health problem. The effects of violence go beyond the harm done to individuals, as violence damages families, communities, and the broader fabric of civic life.”
— Centers for Disease Control and Prevention, Violence Prevention
Understanding crime trends also connects to other policy areas. Iowa’s workforce development and economic growth indicators correlate directly with community safety outcomes. Research consistently shows that areas with lower labor force participation and fewer economic opportunities tend to experience elevated violent crime rates. These relationships inform how Iowa’s performance system treats public safety as an integrated challenge, not an isolated statistic.
Iowa Crime Rate by City
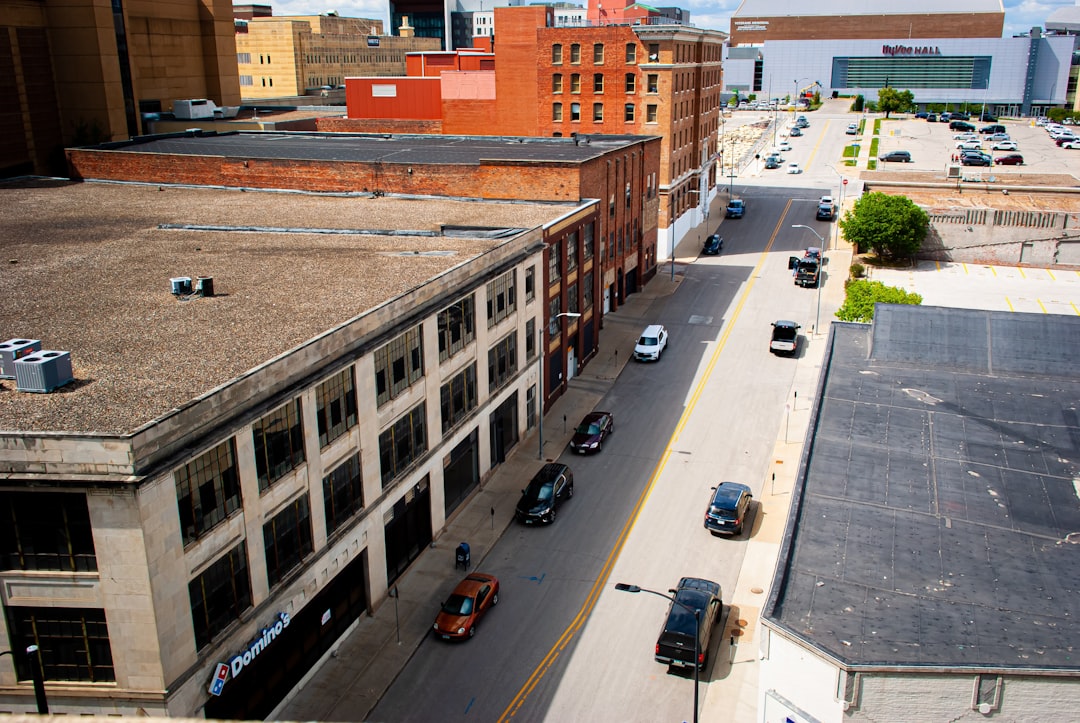
Iowa crime rates vary sharply by city. Des Moines, Davenport, and Waterloo consistently report the highest violent crime rates in the state, while smaller cities and rural counties remain well below national averages. The gap between Iowa’s safest and most at-risk communities reflects differences in population density, economic opportunity, and housing stability.
Davenport, in Scott County along the Mississippi River, has drawn attention from researchers and local officials due to elevated property and violent crime figures in recent years. Waterloo, in Black Hawk County, similarly shows rates that exceed the statewide average by a significant margin. Cedar Rapids sits in a middle range, with ongoing investments in community policing and youth programming aimed at reducing incident totals.
Smaller cities, particularly those with populations under 20,000, typically report single-digit or low double-digit violent crime totals annually. Translated to per-capita rates, those figures are a fraction of the national average. Statewide averages smooth over real differences that residents in specific communities experience every day.
What Is Iowa’s Crime Rate Ranking Nationally?
Iowa ranks among the safer states in the nation. Iowa’s violent crime rate has generally run below the U.S. national average, which the FBI has measured at approximately 380 incidents per 100,000 residents in recent reporting cycles. Iowa typically comes in between 250 and 310 per 100,000, placing it in the lower third of states by violent crime rate.
Ranking comparisons carry real limitations. The FBI’s Uniform Crime Reporting program explicitly cautions that its data should not be used to rank jurisdictions without accounting for factors like population density, economic conditions, and proximity to high-activity transit corridors. Iowa’s favorable ranking reflects genuine progress in many areas, but it doesn’t erase the concentrated challenges in its larger urban centers.
“Rankings based solely on crime rates are not a valid basis for comparisons because such rankings lead to simplistic and potentially misleading conclusions about an agency’s efforts to address crime.”
— Federal Bureau of Investigation, Proper Use of UCR Statistics
Des Moines Violent Crime Rate
Des Moines records a violent crime rate roughly double the statewide average, placing it in a range comparable to mid-sized cities nationally. Recent annual totals have included several hundred aggravated assaults, dozens of robberies, and smaller numbers of homicides, yielding a rate in the range of 500 to 650 incidents per 100,000 residents depending on the reporting year.
That figure reflects the realities of Iowa’s largest city and its economic center. Dense urban environments with concentrated poverty, limited youth programming, and inadequate housing stock have long been associated with elevated crime rates in research literature. Des Moines city officials and Polk County partners have invested in community safety initiatives with outcomes tracked across biennium periods. Progress exists. The work isn’t finished.
For citizens who monitor government services alongside crime data, the Human Services performance area on Results Iowa shows how investments in social support, mental health access, and substance abuse treatment connect to community safety outcomes. These are not separate policy lanes. They interact directly with crime rates and long-term neighborhood stability.
Iowa Crime Map: Reading the Geographic Data
Iowa crime maps visualize incident data at the county and city level, revealing concentration patterns that statewide averages obscure. The corridor running from the Quad Cities through Iowa City, Des Moines, and up toward Waterloo shows the highest incident densities. Rural western and northern Iowa counties consistently post among the lowest violent crime figures in the state.
Crime mapping tools, offered by local law enforcement agencies and state data portals, allow residents to search incidents by address, neighborhood, or ZIP code. These tools typically lag real-time data by days to weeks but provide meaningful trend information. Residents in higher-density areas use them to track whether specific locations are improving or deteriorating over reporting periods. That kind of open measurement is exactly what transparent government accountability requires.
What Drives Crime Rates, and What Is Iowa Doing About It?
Crime rates don’t exist in isolation. They reflect the combined pressure of economic stress, educational outcomes, substance abuse, and housing stability. Iowa’s performance measurement system recognizes this interconnection. State programs targeting drug control, workforce training, and educational attainment all carry public safety implications, even when they aren’t formally categorized as criminal justice initiatives.
The state’s pseudoephedrine control law, for example, was implemented with a direct expectation of reducing methamphetamine production and the violent crime associated with it. Educational outcomes carry long-term relevance as well. Research linking school achievement to reduced adult criminal involvement is well established across the policy literature. Readers interested in how Iowa tracks educational performance can explore Iowa’s STEM proficiency rates for students, one of the measurable indicators that connects classroom outcomes to workforce readiness and community health over time.
It’s also worth noting what crime statistics don’t tell you. They capture reported incidents, not total victimization. Significant portions of assault, sexual violence, and domestic violence go unreported in every jurisdiction. Iowa, like every state, has work to do in building trust between underserved communities and law enforcement so that full reporting becomes possible and intervention can happen earlier.
Practical Steps for Citizens Who Want to Engage With the Data
Crime statistics can feel distant until you know how to use them. Here are practical ways to make the data work for your community:
- Use your local law enforcement portal. Most Iowa city and county departments publish incident maps and annual reports. These provide the most granular data available to the public.
- Compare multiple years, not just the most recent report. Single-year figures can mislead. Trend lines over three to five years reveal whether a community is genuinely improving.
- Read crime rate figures per 100,000, not as raw counts. Raw counts disadvantage large cities. Rate figures allow fair comparisons across communities of different sizes.
- Cross-reference crime data with social services and economic indicators. High-crime areas often correlate with low workforce participation and limited access to mental health services. Results Iowa’s performance areas make these connections explicit.
- Attend public safety budget hearings in your city. Crime rates are outcomes of resource allocation decisions. Citizens who show up to budget sessions have direct visibility into those choices.
- Check the Iowa Department of Public Safety’s annual report. It’s the most authoritative statewide source and breaks data down by county and city for self-directed research.
Iowa’s public safety data landscape is richer than most residents realize. The tools exist. The question is whether citizens are using them to hold state and local government to the measurable results they have every right to expect.
Crime statistics are, at their core, a record of what a community has allowed or prevented. Iowa’s trajectory on violent crime reflects genuine progress in many rural and suburban areas alongside persistent challenges in urban centers that demand continued investment and honest public conversation. Results Iowa exists precisely to provide that transparency, connecting performance data to the policy commitments state government has made to every Iowa resident. When citizens can observe the numbers, ask the hard questions, and track whether answers translate into results, accountability becomes real rather than rhetorical.